

Most marketing conversations revolve around ROAS, CPA, and efficiency metrics. They feel objective, scientific, and controllable.
They are also where many businesses quietly stall.
Not because those metrics are useless, but because they are incomplete. You can optimize them while the business itself goes nowhere.
High ROAS is easy to manufacture by targeting only the warmest demand, limiting scale, and avoiding friction. Dashboards look great. Profit plateaus. Growth stops.
The real question serious operators ask is much simpler:
If we put more money in, do we reliably get more money out, after costs, at scale?
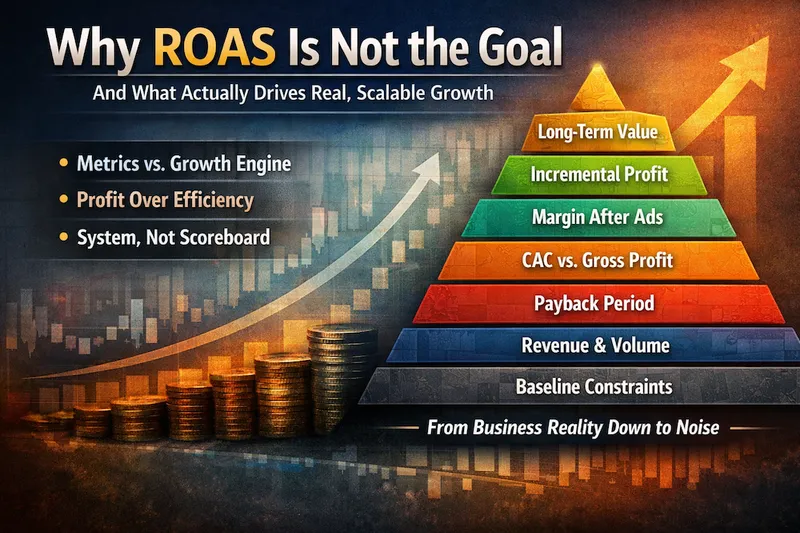
To answer that, you have to stop treating metrics as a flat list and start treating them as a hierarchy. Marketing is not a scoreboard. It is a system.
Some metrics decide direction. Others merely explain behavior.
The Growth Metric Hierarchy
From Business Reality Down to Noise

Level 0: Strategic Constraint
Every business has a ceiling that marketing cannot break.
Inventory limits, fulfillment capacity, pricing, sales throughput, operational complexity, or team capability will cap growth long before ads do.
Scaling spend without addressing constraints does not create growth. It exposes weaknesses faster.
Level 1: Incremental Profit
This is the only score that ultimately matters.
After variable costs, did marketing add real money to the business?
If the answer is no, everything else is commentary.
Level 2: Contribution Margin After Ads
This is the scalability test.
Revenue minus cost of goods or service minus ad spend shows whether growth creates usable cash or just activity.
If this grows with spend, scaling is healthy. If it flattens, you are hitting a wall.
Level 3: Blended CAC vs. Gross Profit per Customer
This determines whether growth is sustainable.
Total acquisition cost across all channels compared against gross profit per customer over a realistic time window.
ROAS can look great while this quietly deteriorates.
Level 4: Marginal Profit and Marginal Returns
Averages lie. Margins are won or lost at the edge.
What happened on the last dollars spent?
This is where real scaling decisions are made.
Level 5: Payback Period

Profit delayed is risk disguised as success.
How long does it take to recover acquisition cost?
Even profitable businesses collapse when payback stretches too long.
Level 6: Cash Flow Timing and Working Capital
Two companies can generate the same profit and have wildly different survival odds.
When cash comes back matters as much as how much comes back.
This layer quietly limits scaling speed.
Level 7: Revenue
Revenue is volume, not value.
Revenue without profit increases stress, complexity, and fragility.
Level 8: Conversion Quality
Not all customers are equal.
Alignment, price tolerance, repeat behavior, refund rates, and support burden determine whether growth is clean or chaotic.
You feel this in operations, not dashboards.
Level 9: Operational Drag and Hidden Costs
Support tickets, exceptions, cancellations, labor, and edge cases quietly erode profit.
Messy growth always costs more than it looks.
Level 10: Funnel Conversion Rates

Click to lead, lead to sale, sale to repeat.
These explain why outcomes change, not whether they matter.
Level 11: Message–Market Fit
This is about resonance, not targeting.
When the story matches how the market thinks, everything downstream gets easier. Costs fall. Conversion improves. Price resistance drops.
Level 12: ROAS
ROAS measures efficiency in isolation.
Useful for diagnostics. Dangerous as a goal.
You cannot deposit ROAS in a bank account.
Level 13: CPA and CPL
These are guardrails, not objectives.
They prevent waste but do not determine success.
Level 14: CTR, CPC, CPM
These reflect auction pressure, relevance, and competition.
They describe conditions, not outcomes.
Level 15: Attention Quality

Not all impressions are equal.
Context, intent, placement quality, and trust environment determine whether attention is valuable or expensive noise.
Cheap attention is often the most costly.
Level 16: Impressions and Reach
Exposure alone does nothing.
Visibility without downstream impact is just noise.
Level 17: Brand Effects You Cannot Track
Some forces shape results without appearing in dashboards.
Delayed brand searches, faster sales cycles, referrals, higher price tolerance, and reduced friction live here.
You infer them when everything else gets easier.
Level 18: Competitive Signaling
Markets react to pressure.
Your spend changes competitor behavior, bidding strategies, and offers. These second-order effects shape performance over time.
Level 19: Cultural and Market Context
Seasonality, consumer confidence, platform shifts, and macro conditions form the environment you operate in.
Ignoring this layer guarantees misinterpretation of results.
Level 20: Long-Term Enterprise Value

This is the quiet outcome of great marketing.
Pricing power, defensible demand, channel independence, and higher valuation multiples are built slowly, not optimized in dashboards.
The Takeaway
Metrics closer to impressions explain behavior.
Metrics closer to profit decide direction.
ROAS is not wrong. It is just incomplete.
When marketing is managed as a system instead of a scoreboard, decisions get calmer, scaling gets safer, and growth stops feeling like a gamble.
That is the difference between running ads and building a growth engine. Contact us today to learn more about how we can help your business grow.