Smoky Mountain Market Market Comeback Chart Daily Analysis
The data below is updated daily to visually show you how the market is doing and how close we are to business as usual in the Smoky Mountain Tourism Community
The data below is updated daily to visually show you how the market is doing and how close we are to business as usual in the Smoky Mountain Tourism Community
New Data Update Date Video
Data in the new Smoky Mountain Tourism COVID-19 Dashboard is updated daily. The data updated daily to visually show you how the market is doing and how close we are to business as usual in the Smoky Mountain Tourism Community. Click on the button below to view the dashboard.
Last Updated April 16, 2020
Theaters Announce Closure to May 9, Closure Begins March 21 (Comedy Barn, Hatfield & McCoy, Dolly Parton’s Stampede, Pirates Voyage, Smoky Mountain Opry)
West Virginia Announces Stay at Home Order
Dollywood Closes DreamMore Resort and Spa
Kentucky Warns Residents Not to Travel to Tennessee
Virginia Issues Stay at Home Order Until June 10
Cabin Rental Companies Begin Blocking Calendar Dates to Prevent Vacations
Florida Announces Stay at Home Order through April 30
Ohio Stay at Home Order Extended through May 1
Indiana Issues Stay at Home Order through April 20
Tennessee Gov. Bill Lee said in a news conference Monday he will not extend the state’s Safer at Home order past April 30 meaning the “vast majority” of businesses in 89 of the 95 counties in Tennessee will be allowed to reopen May 1.
In the past 3-4 weeks, our industry has been majorly impacted. We have been reacting to a crisis that continues to evolve by the day, if not by the hour. We wanted to bring you some data that may help you make some decisions in your business and give you some insights on how the Smoky Mountain market is doing in regard to tourism.
As of April 12, 2020, we have written over 17 articles about the tourism and vacation rental industry. If you have not checked them out, you can CLICK HERE. We are here to serve you and help protect your business by taking the most minimal impact as possible. We hope you find this information helpful.
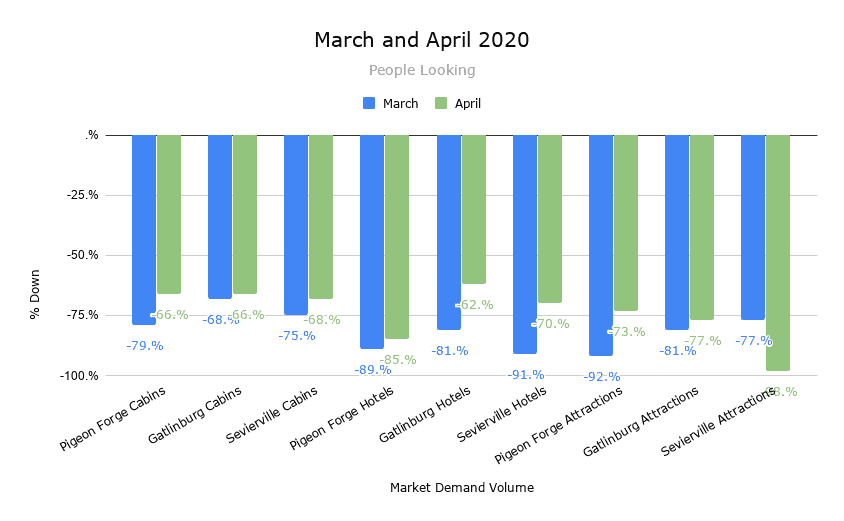
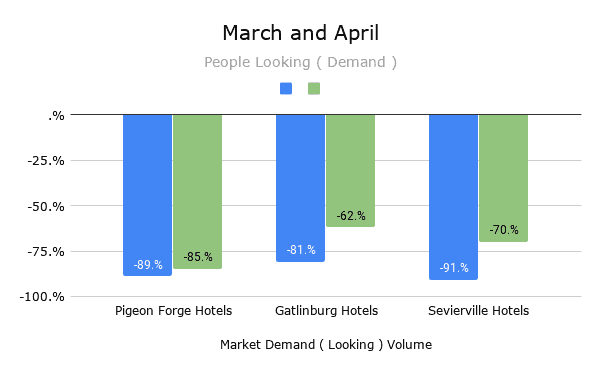
This data is by city and by industry. This data is showing you the amount of people searching online. Since over 90% of travel is researched online, this is a good indicator of how healthy a market is.
Data Source: Google Trends
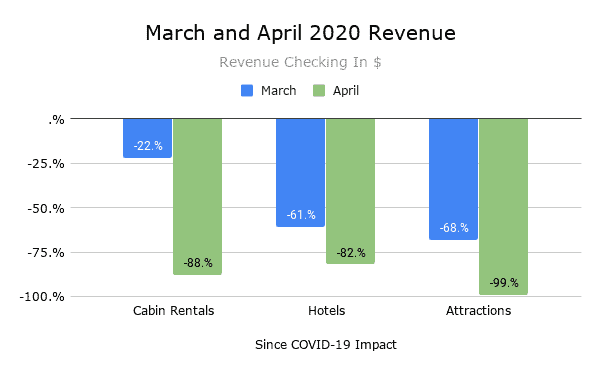
This data is revenue by tourism industry and has been compiled from all 3 cities – Gatlinburg, Pigeon Forge and Sevierville. The data is based on people checking into hotels or vacation rentals. For attractions, data is based on actual purchase date, but keep in mind that attractions tend to see much closer “look to book” windows.
Data Source: Market Data Pulled from Google E-commerce Data for the Smoky Mountain Market
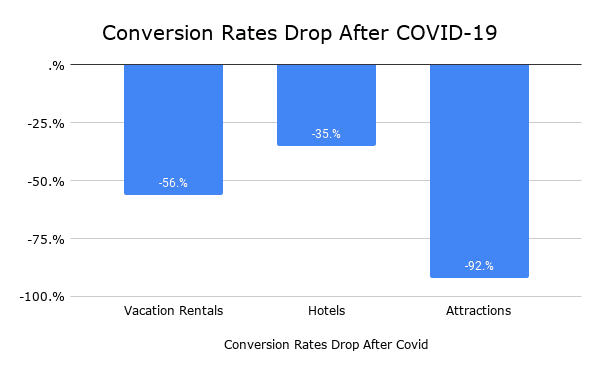
This data is the conversation rate shift by industry and has been compiled from all 3 cities – Gatlinburg, Pigeon Forge and Sevierville. The data is based on people checking into hotels or vacation rentals. For attractions, data is based on actual purchase date, but keep in mind that attractions tend to see much closer “look to book” windows.
Data Source: Market Data Pulled from Google E-commerce Data for the Smoky Mountain Market
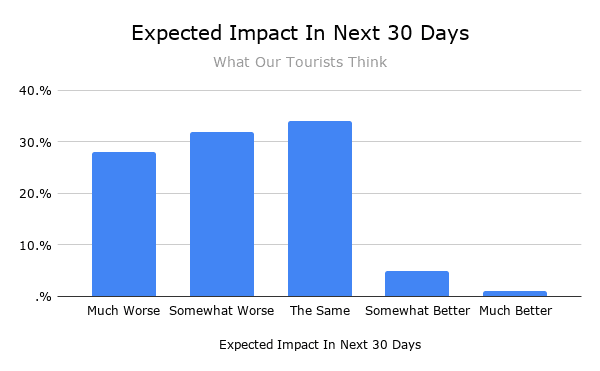
This data was collected from people who have visited and have returned at least once per year. This is how they feel about COVID-19 and the impact on travel to the Smoky Mountains.
Data Source: Market Data Pulled from a survey of people who visit the Smoky Mountains
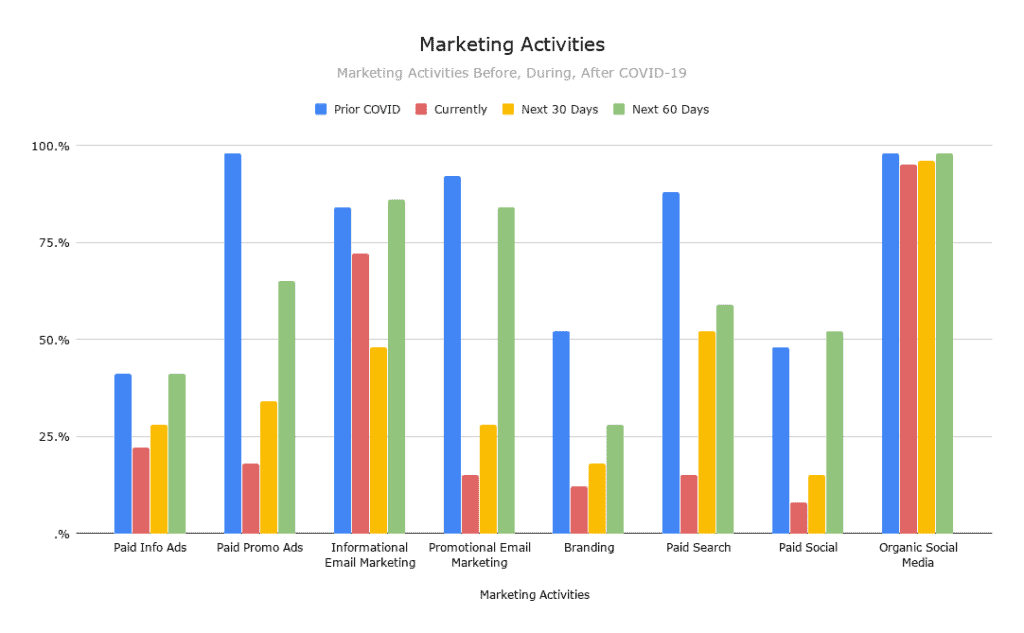
Where did the Smoky Mountain tourism market shift budgets to?
Data Source: Market Data Pulled from over 35 IMEG Marketing Clients
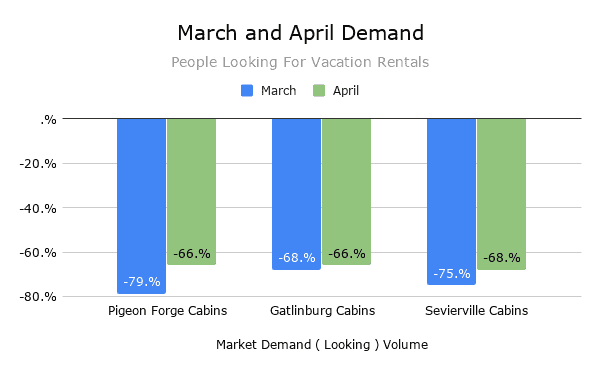
This data is by city and is based on people looking to travel and stay in a cabin rental.
Data Source: Google Trends
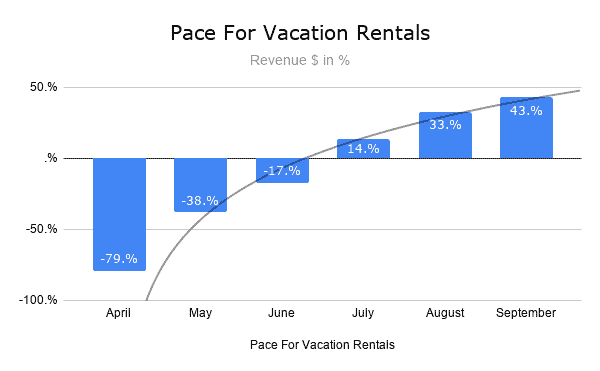
This is revenue pace based on check in date (pre-books).
Data Source: IMEG Data Pulled from Over 35 Vacation Rental Clients, Anonymized.
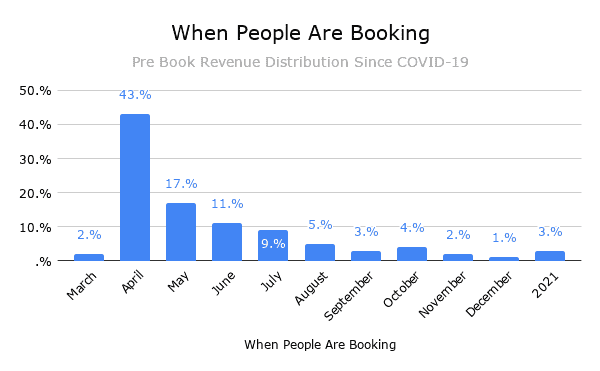
This data shows us when people have been booking since March 23, 2020. These are new reservations – not rescheduled reservations. Market search volume, or what we call intent, started to decline on March 11 then continued to drop until March 23 and has remained flat ever since.
Data Source: IMEG Data Pulled from Over 35 Vacation Rental Clients, Anonymized.
Data Source: Google Trends
Market search volume, or what we call intent, started to decline on March 11 then continued to drop until March 23 and has remained flat ever since.
Data Source: Google Trends
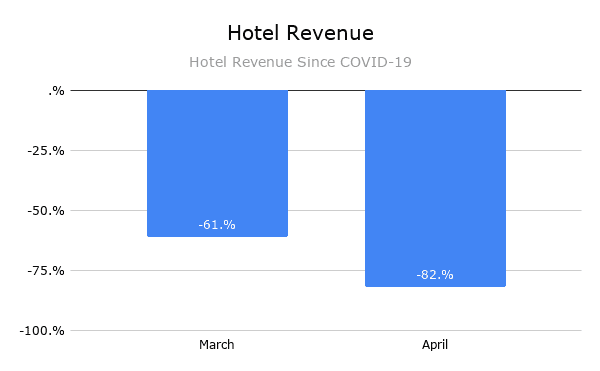
This is how much hotel revenue has dropped in Sevier County including all 3 cities, Pigeon Forge, Gatlinburg and Sevierville.
Data Source: IMEG Data Pulled from Over 20 hotel clients, Anonymized. Google E-commerce
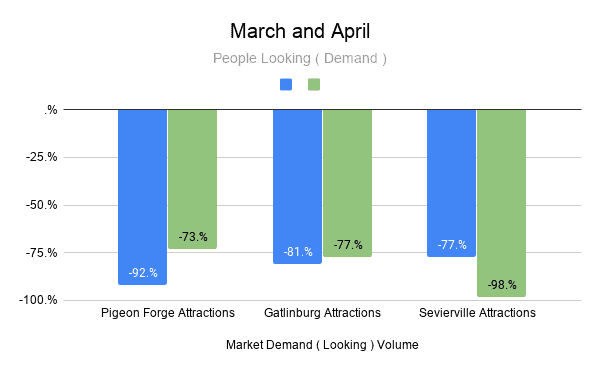
This data is by city and is based on people looking for attractions in each respective city.
Data Source: Google Trends
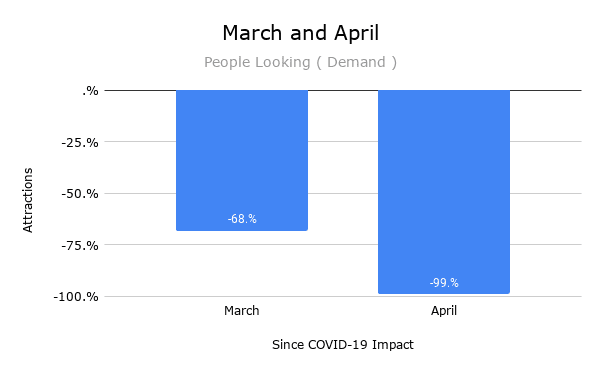
Revenue decline for attractions in Sevier County, TN during COVID-19.
Data Source: IMEG Data Pulled from Over 10 Attraction Clients, Anonymized.
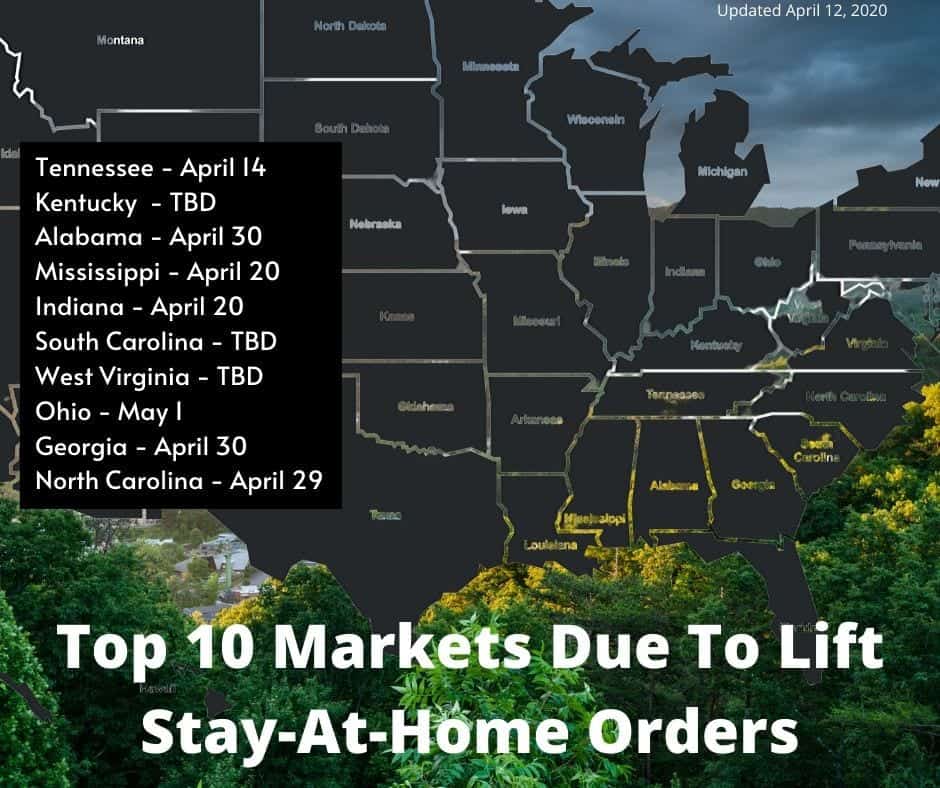
Watching our feeder markets is important. We may be open for business, but our visitors may still be under Stay-At-Home Orders. They may not be able to travel which impacts our revenue and market overall.
It is always important to know the demographics and psychographics of your visitor, but it is critical we know and watch for shifts now more than ever.
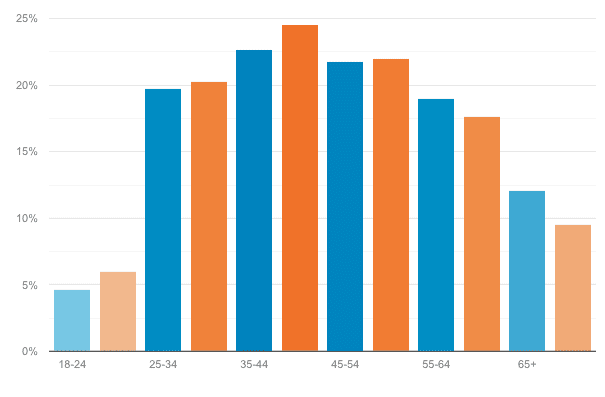
By Age: We may see a slow down for 3-6 months of visitors over the age of 65.
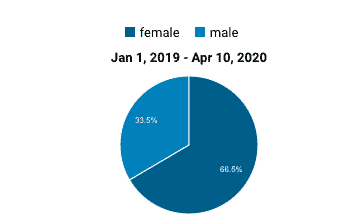
This is a pie chart of decision makers (who plans Smoky Mountain vacations) by gender.
The darker the blue, the more market share there is in that state for the Smoky Mountains. We will want to watch Stay-At-Home Orders being lifted to help us predict pent-up demand.

By State: The darker the state, the more visitation from that state.
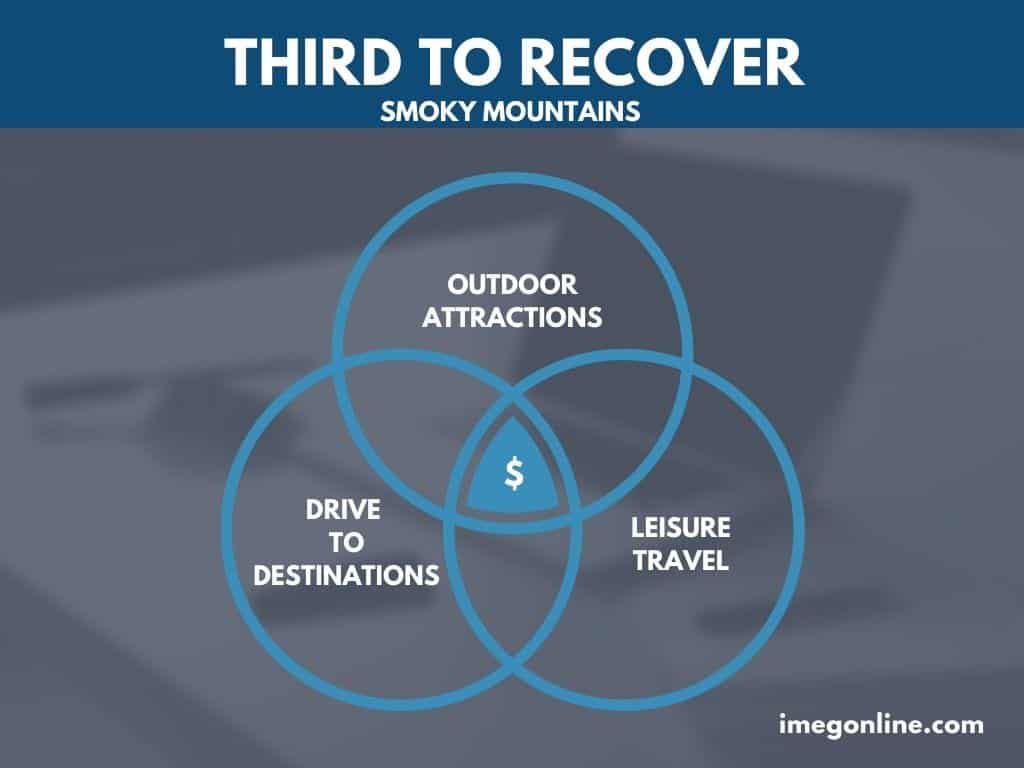
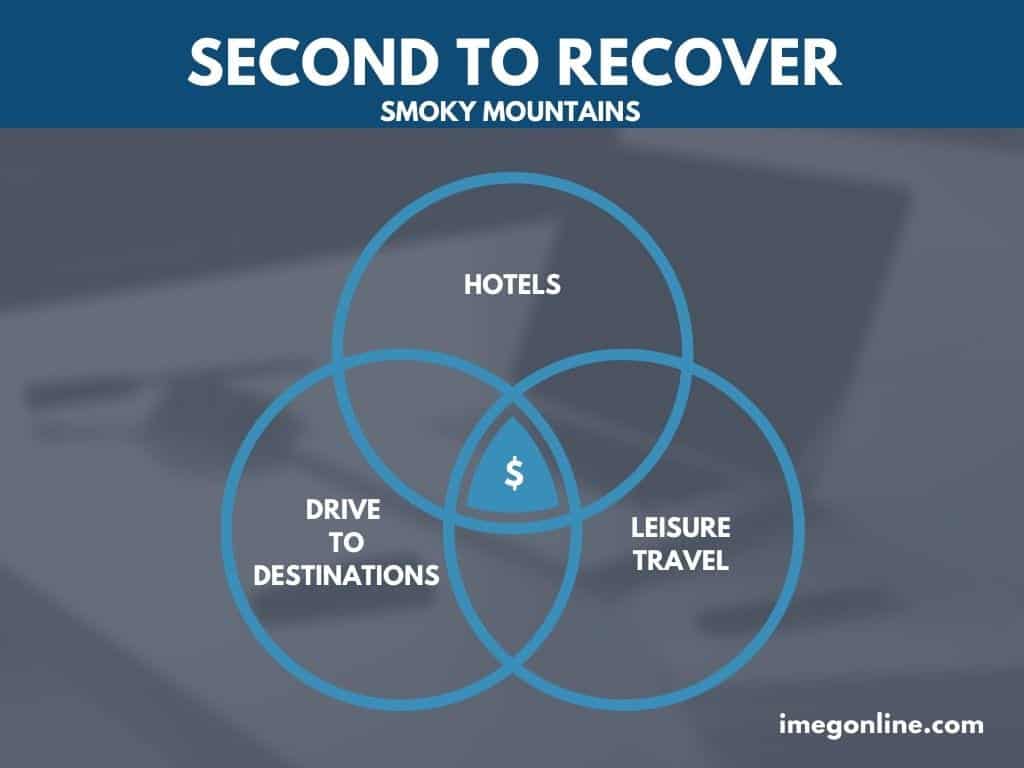
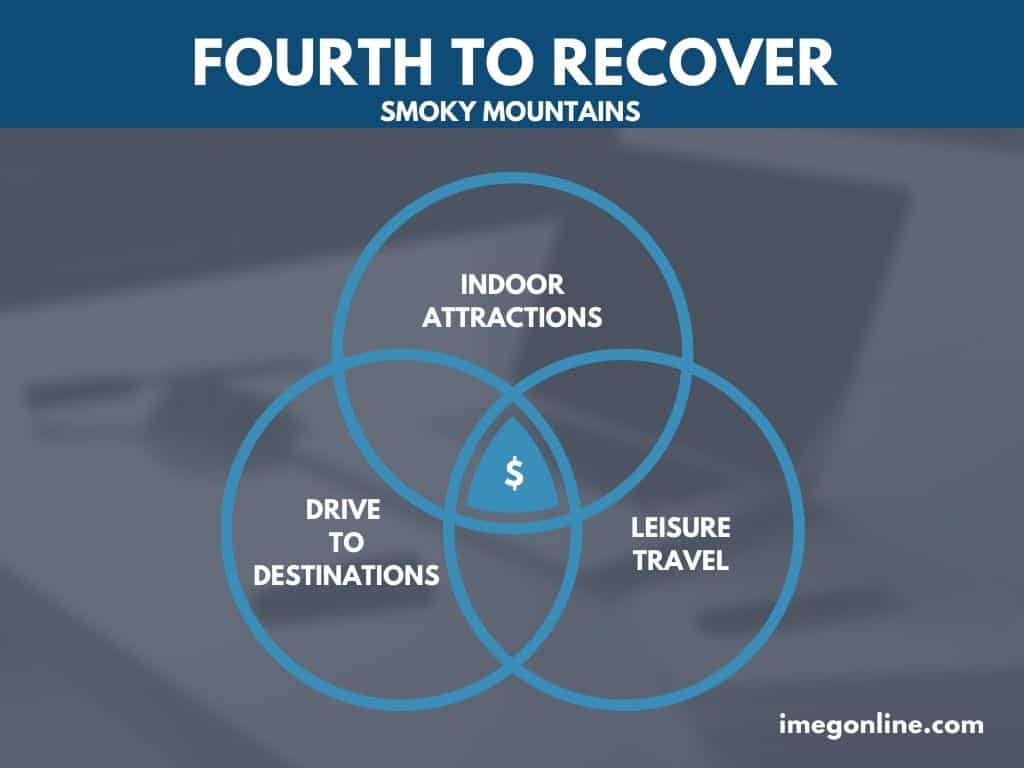
We predict travel will come back in the following order: 1. Drive-to Markets 2. Leisure Markets 3. Vacation Rentals 4. Hotels 5. Outdoor Attractions 6. Indoor Attractions 7. Fly-To National Markets 8.Group Travel 9. Business Travel 10. International Travel 11. Cruise Ship Travel
We predict travel will come back in the following order: 1. Drive-to Markets 2. Leisure Markets 3. Vacation Rentals 4. Hotels 5. Outdoor Attractions 6. Indoor Attractions 7. Fly-To National Markets 8.Group Travel 9. Business Travel 10. International Travel 11. Cruise Ship Travel
We predict travel will come back in the following order: 1. Drive-to Markets 2. Leisure Markets 3. Vacation Rentals 4. Hotels 5. Outdoor Attractions 6. Indoor Attractions 7. Fly-To National Markets 8.Group Travel 9. Business Travel 10. International Travel 11. Cruise Ship Travel
We predict travel will come back in the following order: 1. Drive-to Markets 2. Leisure Markets 3. Vacation Rentals 4. Hotels 5. Outdoor Attractions 6. Indoor Attractions 7. Fly-To National Markets 8.Group Travel 9. Business Travel 10. International Travel 11. Cruise Ship Travel
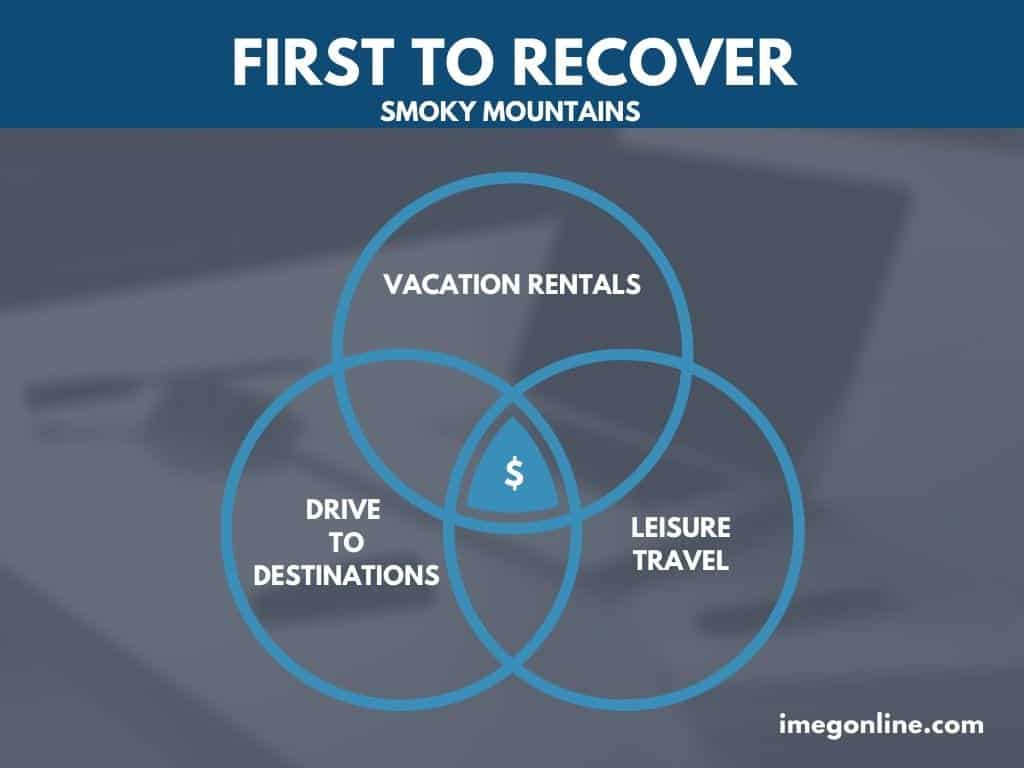
We believe the Smoky Mountain tourism market is in a sweet spot for various reasons. The Smoky Mountains are a drive-to, leisure market which we predict will be the first to recover. We also have some huge, new opportunities.
People who can’t, or choose not to, visit larger theme parks, like Disney World, who may be shut down longer than us.
We believe that the pent-up demand will be huge after all this settles. As we have mentioned, the Smoky Mountain area will be one of the first travel market types to recover, so we need to be sure our marketing, business infrastructure and new messaging match the travel behavior shifts, so we are ready as soon as the market is ready and open.
We think we can pick up some market share from international travelers who love the outdoors. These visitors will spend more and stay longer if we can get in front of them and let them know the Smoky Mountains are a great place to visit this year.
Many of the cruise ships have stopped cruises until November and may extend that date even further out. Millions of people had cruises scheduled and are now looking for a safe place to travel, not internationally. While most cruise budgets are less than international travel. The Smoky Mountains are a lower budget destination which is ideal for a vacation alternative.
We believe people will lean more toward outdoor experiences for a while after the COVID-19 pandemic. The Smoky Mountain area is an amazing place to promote outdoor experiences and attract a potentially new visitor who hasn’t heard of us.
We believe people will be looking for small hotels and vacation rentals to continue some form of social distancing for quite some time. Unlike larger travel destinations, like Las Vegas, the Smoky Mountain area has smaller hotels (150 rooms or less). Our cabin rentals will also help us be a destination of choice for the next 12-18 months because people will feel like they are still being socially distant by staying in a cabin rental.
Below are what we predict will be the top shifts in travel in the Smoky Mountain tourism market.
With the uncertainty of whether or not there will be another round of COVID-19, coupled with the media’s coverage of businesses not giving refunds or cancellations in a crisis, the consumer is aware and may choose a company based on cancellation and refund policies – something they did not do before.
We predict a shift in people wanting to know how you will protect them from being exposed to COVID-19. They will want to know you screen employees, clean your facility and take all measures to protect them.
Clearly stating how you clean and how it specifically reduces the risk of exposing guests to COVID-19 will be key to revenue and conversion in your travel business.
Reviews have always been a very important part of the booking process. In fact, over 71% of travelers use reviews to help make a travel decision. We believe reviews will become an even greater percentage of decision-making. They will look to see how you handled refunds, cancellations and rescheduling during the pandemic as an indicator of how they may be handled in the future. Be certain your reviews are positive and cleaned up before the pent-up demand starts to travel again. You will want to make sure negative reviews do not impact your conversions. Also note, if you are on platforms like airbnb review algorithms may be off so be sure and monitor your rankings to be sure showing up on page 1 or 2 in your respective categories.
People trust people. If you have good reviews, be sure you have them showing on your assets, such as your website, because people will rely more on social proof to book travel after this shift. If you don’t have good reviews, you need to work on getting some to improve your chances to convert after the market reopens.
Group travel for sports, business and motor coach will be slower to return to normal than individual and family travel, so be sure you adjust marketing and budgets accordingly.
Below is a list of the top indicators to watch to determine when the tourism market will come back. We have listed them below in sequential order by indicator.
Previous epidemics or recessionary events have depressed travel demand for 4-7 months before beginning to recover, according to Dufry (DUFN) and Amadeus (AMS). Aggressive containment measures with an immediate severe economic impact could help contain the virus spread, leading to lesser long-term, negative, economic implications. Amadeus recently noted that previous disease outbreaks recovered 6-7 months after the peak of the outbreak. Drawing on the SARS experience in China, Trip.com’s (TCOM) second-quarter 2003 revenue fell 42% sequentially and bounced back 196% sequentially in the third quarter. However, we don’t think recovery from COVID-19 will be as quick as SARS, which was not as widespread globally.
We need to watch these dates as people in our feeder markets are unable to travel. We may be open, but they’re unable to travel.
People have to look before they book and we will see an increase in people searching online before they book. This will allow us to see the indication that there is an intent to travel to our market.
While we need to keep our core marketing efforts going and not cut any marketing assets that have a positive Return on Ad Spend (ROAS), we do need to let the big companies (the ones with more data and more money) give us some indication of people willing to travel and book. We want to watch this before we turn on our paid ads, like Google AdWords, at full scale. Watch your distribution channels, like OTAs such as booking.com, VRBO, and airbnb. When you start seeing a steady influx of reservations from them, you will know it is time so start scaling up your marketing efforts for direct revenue.
Watch your website closely for an increase in traffic from organic search and people actually booking from it. This will be the first indication the market is back for you. You can set up a Google Alert (if you use Google Analytics) to let you know the moment it happens, so you don’t miss big opportunities to be one of the first to market to the demand.
Pay close attention to these metrics once you do see demand start to come back. 3 places to watch: (1) the booking to arrival analysis in your point of sale or property management system (2) the days to transaction in Google Analytics and (3) Google E-commerce conversion rate. You probably are just coming out of a cash flow injury so watching the core marketing metrics Cost Per Acquisition (CPA) is CRITICAL. CPA is critical to ensure your marketing assets are doing what they should doing – creating revenue that creates profit that creates cash. You probably need cash now more than ever, so be certain you are watching this metric if nothing else. At the first inflection point in the market, in mid-March, we saw search slowly declining and pace was slower than conversion. We may see that again – people were looking and not booking.
Watch your pace reports by month and if you can, by weekend. IMEG tracks this weekly for vacation rentals. It is key you watch this so you know which marketing levers to throw to ensure we get good ROI and cash from our marketing assets.
In conclusion, we believe the Smoky Mountain market will be one of the first to rebound. We do think this impact on tourism recover in phases. Each phase, with the first one beginning around March 18th, will take 4-6 days. Once we do see some of the data start to turn in our favor, we believe like most things, from a physics perspective, will follow at same timeline. We see consistent data to show the turnaround has begun plus the amount of time it has been since around mid-March 2020 also means the turnaround is near. The good news: we do have some indicators and data to help us know and we can get a better understanding and make better predictions. The one thing we must consider are opportunities to be prepared for pent-up demand and preserve cash flow since we may see more rounds of this. I would be cautious and watch our fall season and revenue closely because we may see a slight or mid-range return of this pandemic in the fall.
Be sure to sign up for updates from IMEG. We have been watching the market very closely for over a decade and we will keep you updated.
Sign up with your mobile number below to receive the latest market updates.

Contact us for a free consultation to learn how IMEG can help grow your business.
“Marketing is a contest for people’s attention.”
“99% of people don’t market in the year that we actually live in.”
“Simplify with these questions.
1. Who buys from me? 2. What causes them to buy?
3. How do you keep them buying? 4. What prevents them from buying?”
“A man who stops advertising to save money is like a man who stops a clock to save time.”